By providing a platform for as many members as possible to voice their concerns, a union was in for a surprise. The top issue the wider group of members wanted the union to focus on hadn’t be flagged as a priority before: Namely, the need to break the adverse work culture that expects workers to put more hours in then they are paid for. Read in below how the use of the survey tool ThoughtExchange is putting a healthy work-life back on the agenda!
One of the key objectives of the Young Workers’ Lab has been to trial new methods to improve union democracy.
Since we published results in spring 2019, we’ve now run over thirty tests of an anonymized survey tool called ThoughtExchange with UNI sectors and affiliates in the UK, South America, Australia and Europe. The tool allows members (and non-members) to have their say without restrictions such as being in a certain location at a certain time. This is crucial for young workers and those who cannot attend union meetings or are maybe uncomfortable speaking up in public.
The tool works as follows. First, the union asked their members the following question (each ThoughtExchange is based around one question):
What small things can we do together that will improve the working lives of everyone who works in [the sector]?
Members can respond with as many answers as they wish. They are also invited to score the answers that came in. The tool is designed so that every answer given is shown an equal number of times to the group as a whole, which means that the first answers don’t automatically become the ones that everyone votes to the top. This ensures democratic participation even when the group size hits the tens of thousands.

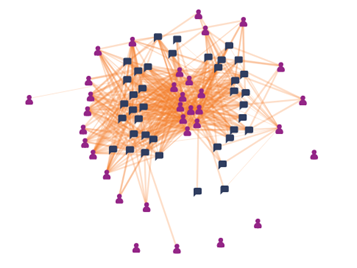
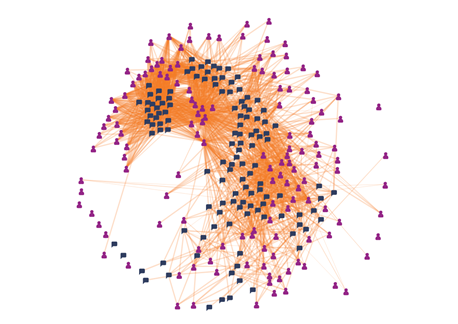
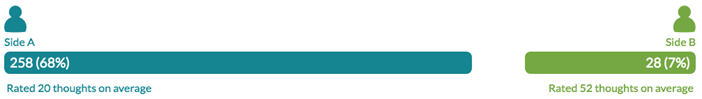
This ThoughtExchange had 1029 total participants. It was sent to roughly 2000 members and posted on some non-member Facebook groups as well. That group of 1029 posted a total of 370 answers to the question above. They ranked those answers a total of 7843 times, which refined them into a list of most popular to least popular answers. The visualizations below show how the members interacted throughout the course of the 2-week survey:

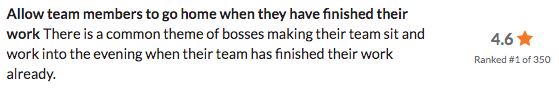
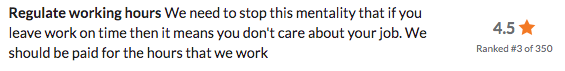
Below are the #1 and #3 most popular answers. Both point to unregulated working time as being a core issue for members in this sector.
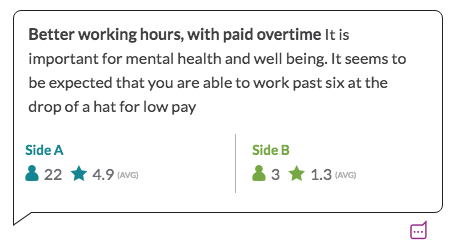
As might be expected, some issues are more polarising than others. The backend of the tool provides a glimpse into which issues were most divisive. In this outing, a small group (3 members) felt very strongly that paid overtime was not a priority issue (1.3 stars out of 5), despite a larger group (22 members) feeling that it was almost as important as the rating permit (4.9 stars out of 5).
One interesting finding from this survey was that the less vocal members of the union had different priorities than the more vocal members. In the past, the union had tended to receive lists of priority issues from active members only.

When we asked about the results, the survey’s organizer wrote, ‘When we did the ThoughtExchange, there was a really clear winner “issue” in terms of giving us a list of the things that we should be tackling. Tellingly, it was an issue that wasn’t even on the list of priorities that our core group of active members gave us.’ The organizer considered this unfortunate because they felt that the latter group most resembles the vast majority of non-members whom they would like to recruit. Engaging with members in a new way thus provided the organizers with a broader range of perspectives. This helps boost union democracy and could keep the union attuned to the priorities of voices that might otherwise go unheard.
On the issue of participation, they added that the existing strength of the network made a difference in turnout. ‘I don’t think we would’ve got that without having a degree of convening power already (already-active Facebook groups etc). If we’d promoted it just by sending out an email, my guess is that we have had a fraction of the response.’
There are many digital survey tools available online.
When asked what they might change about the tool, the union stated that would like to be able to conduct surveys with more identifying features, like which department respondents work in. This wouldn’t need to come at the expense of anonymity. The extra information would simply be useful in segmenting and meeting member’s needs with more precision. In fact, ThoughtExchange can be configured to have respondents answer initial questions like age, gender, or department. As with any survey, this is a fine line to walk. Asking too many identifying questions upfront can cause attrition amongst participants. ThoughtExchange reports to us that users tend to get distracted and leave if they have to answer three or more questions before participating in the survey.
Since this test was run, the ‘winner’ issue has become a topic of conversation for a global campaign, which is an exciting development!
Learn more about new tools in our Connective Action: Digital Tools for Trade Unions. ThoughtExchange is a paid tool; please be in touch with UNI Global Union if you are an affiliate who would like to try it. Want a free alternative? Try All Our Ideas!
For the sake of anonymity, we have anonymised the sector that this survey was conducted in.